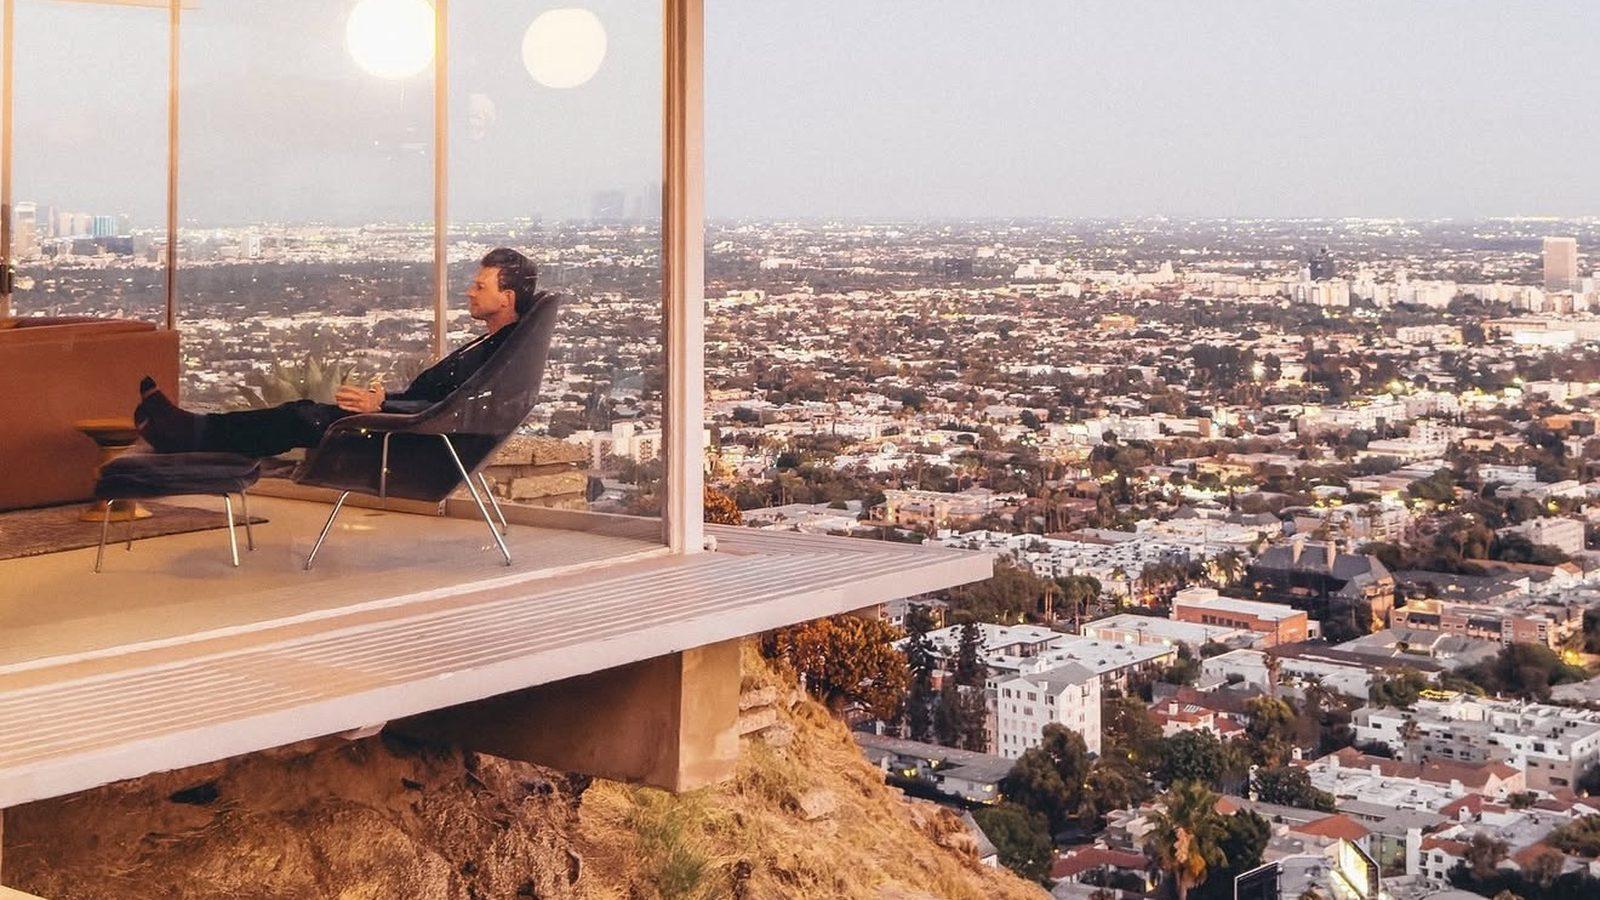
Los Angeles is not one market but dozens. This update looks at October 2026 sales in the luxury neighborhoods on this site, from the beach towns of the South Bay to Bel Air and Hancock Park, side by side, with what it takes to buy in each.
October by Neighborhood
Each neighborhood on its own, since Los Angeles prices vary more from one neighborhood to the next than anywhere else in Southern California.
Across the 22 neighborhoods in this update, 82 homes closed in October. The most sales were in Sand Section, Manhattan Beach (18). Prices ran highest in Brentwood Park, at a median of $11,550,000, and lowest in Silver Strand & Marina Peninsula, Venice, at $1,350,000.
| Neighborhood | Oct Sales | Oct Median | Aug to Oct Sales | Aug to Oct Median |
|---|---|---|---|---|
| The Strand, Manhattan Beach | 2 | – | 2 | – |
| Sand Section, Manhattan Beach | 18 | $5.21M | 38 | $4.56M |
| Tree Section, Manhattan Beach | 9 | $3.48M | 23 | $3.89M |
| The Strand, Hermosa Beach | 0 | – | 1 | – |
| Hollywood Riviera, Redondo Beach | 8 | $2.1M | 22 | $1.95M |
| Venice Canals, Venice | 1 | – | 4 | $2.45M |
| Silver Strand & Marina Peninsula, Venice | 2 | – | 12 | $1.35M |
| Lunada Bay, Palos Verdes Estates | 4 | $3.05M | 23 | $2.9M |
| Malaga Cove, Palos Verdes Estates | 2 | – | 9 | $3.5M |
| North of Montana, Santa Monica | 10 | $7.91M | 41 | $4.29M |
| Bel Air | 6 | $3.66M | 21 | $3.05M |
| Beverly Hills Flats, Beverly Hills | 5 | $8.68M | 20 | $8.4M |
| Beverly Hills Post Office | 9 | $3.35M | 25 | $3.35M |
| Bird Streets | 1 | – | 4 | $11.3M |
| Brentwood Park | 0 | – | 5 | $11.6M |
| Mandeville Canyon | 1 | – | 3 | $3.11M |
| Hancock Park | 2 | – | 5 | $3.12M |
| Windsor Square | 0 | – | 4 | $1.82M |
| Fremont Place | 0 | – | 1 | – |
| Laughlin Park | 1 | – | 2 | – |
| Outpost Estates | 0 | – | 4 | $2.85M |
| Whitley Heights | 1 | – | 1 | – |
Income Needed by Neighborhood
| Neighborhood | Median Price | Monthly Cost | Income, Monthly |
|---|---|---|---|
| Sand Section, Manhattan Beach | $5.21M | $34,467 | $123,095 |
| Tree Section, Manhattan Beach | $3.48M | $23,066 | $82,379 |
| Hollywood Riviera, Redondo Beach | $2.1M | $13,899 | $49,640 |
| Venice Canals, Venice | $2.45M | $16,232 | $57,972 |
| Silver Strand & Marina Peninsula, Venice | $1.35M | $8,935 | $31,911 |
| Lunada Bay, Palos Verdes Estates | $3.05M | $20,158 | $71,993 |
| Malaga Cove, Palos Verdes Estates | $3.5M | $23,159 | $82,710 |
| North of Montana, Santa Monica | $7.91M | $52,370 | $187,036 |
| Bel Air | $3.66M | $24,221 | $86,503 |
| Beverly Hills Flats, Beverly Hills | $8.68M | $57,417 | $205,060 |
| Beverly Hills Post Office | $3.35M | $22,206 | $79,306 |
| Bird Streets | $11.3M | $74,460 | $265,928 |
| Brentwood Park | $11.6M | $76,445 | $273,019 |
| Mandeville Canyon | $3.11M | $20,571 | $73,467 |
| Hancock Park | $3.12M | $20,617 | $73,633 |
| Windsor Square | $1.82M | $12,040 | $43,000 |
| Outpost Estates | $2.85M | $18,893 | $67,475 |
Same assumptions as above, at each neighborhood’s October median, or its three-month median when October had too few sales.
Closed sales of single-family homes, condos and townhomes recorded in CRMLS. Sale-to-list compares each sale price with the final asking price. Figures are deemed reliable but not guaranteed.
See the Los Angeles guide for homes for sale and the market right now.