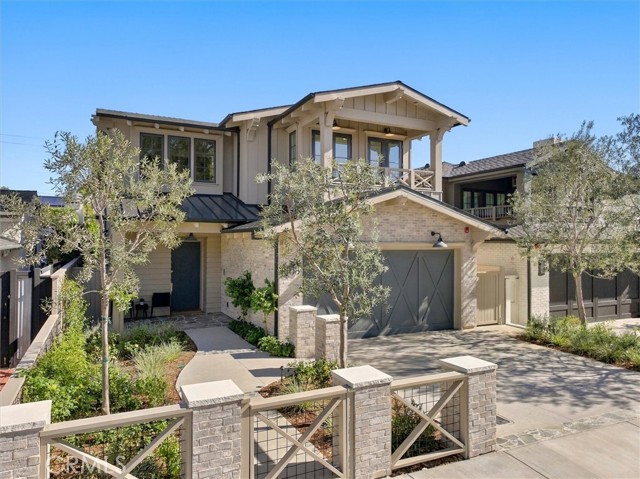
Manhattan Beach, CA 90266
1808 Laurel Ave
Open house: Sat 1-4pm (11/14)
$8,629,000
5 BD · 6 BA · 4,720 SQFT
Listed by Barry Host, Vista Sotheby’s International Realty
Manhattan Beach
16
Homes for Sale
$4,099,000
Single-Family Median List Price
–
Condo & Townhome Median List Price
$1,487
Price per Sq Ft
22
Avg. Days on Market
$4,350,682
Avg. Sold Price (90 Days)
Active listings in Tree Section as of , per CRMLS. Sold price averages the 22 homes that closed in the last 90 days. A dash means too few listings or sales to publish a meaningful figure. Updated daily.
Current Listings
The 12 highest-priced homes on the market now, updated from CRMLS throughout the day.
Manhattan Beach, CA 90266
Open house: Sat 1-4pm (11/14)
$8,629,000
5 BD · 6 BA · 4,720 SQFT
Listed by Barry Host, Vista Sotheby’s International Realty

Manhattan Beach, CA 90266
Open house: Sat 1-4pm (11/14)
$8,379,000
5 BD · 7 BA · 4,987 SQFT
Listed by Sarah Saypack, Vista Sotheby’s International Realty
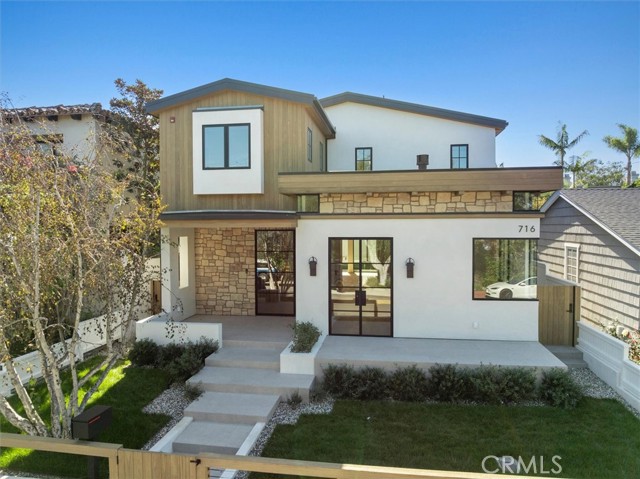
Manhattan Beach, CA 90266
Open house: Sun 1-3pm (11/15)
$7,449,000
5 BD · 5 BA · 4,523 SQFT
Listed by Teri Hawkins, Estate Properties
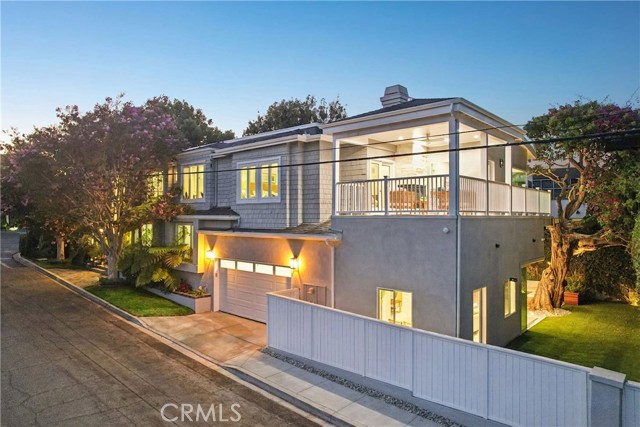
Manhattan Beach, CA 90266
Open house: Sat 1-4pm (11/14)
$6,995,000
6 BD · 7 BA · 5,220 SQFT
Listed by Edward Kaminsky, eXp Realty of California, Inc
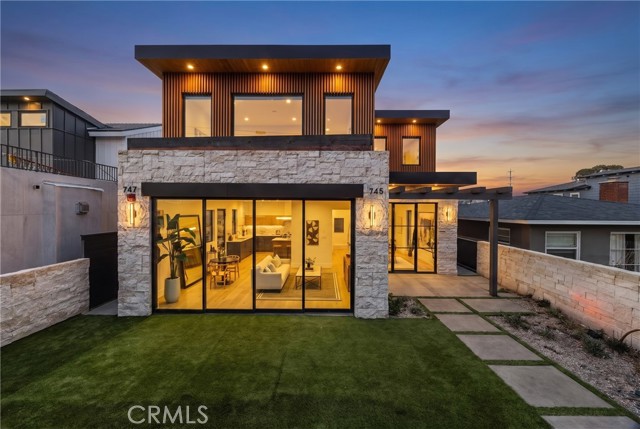
Manhattan Beach, CA 90266
Open house: Sat 2-4pm (11/14)
$6,495,000
5 BD · 6 BA · 4,085 SQFT
Listed by Joseph Nuzzolo, Thompson Team Real Estate, Inc.
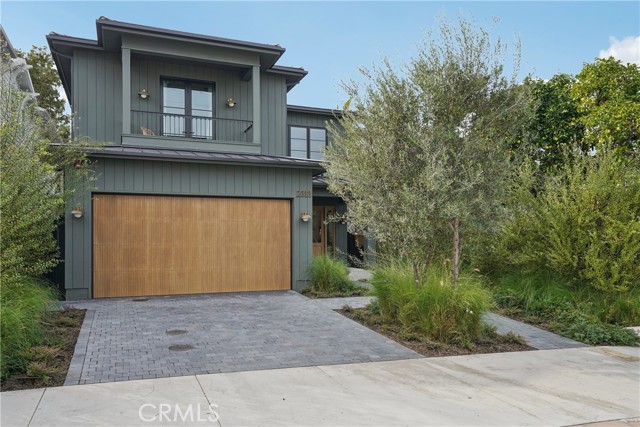
Manhattan Beach, CA 90266
Open house: Sat 1-4pm (11/14)
$5,850,000
5 BD · 6 BA · 3,198 SQFT
Listed by Edward Kaminsky, eXp Realty of California, Inc
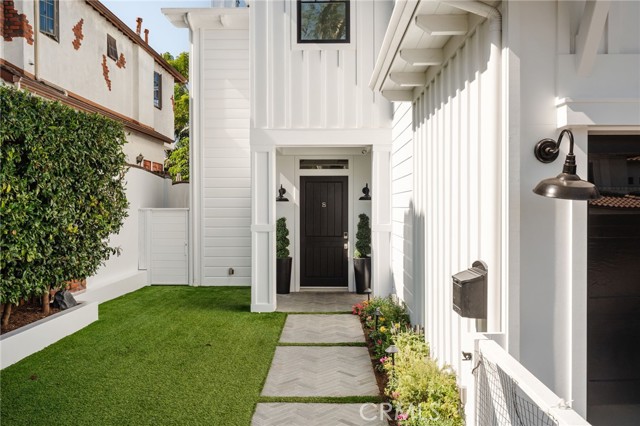
Manhattan Beach, CA 90266
$4,650,000
5 BD · 5 BA · 3,347 SQFT
Listed by Rob Depaoli, Compass
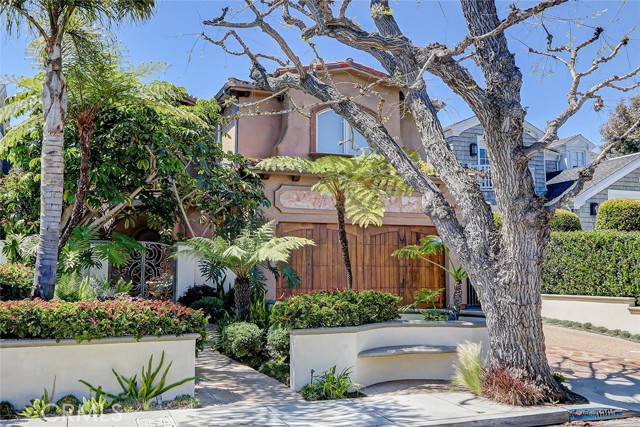
Manhattan Beach, CA 90266
$4,499,000
5 BD · 4 BA · 3,262 SQFT
Listed by Robert Freedman, DOMO Real Estate
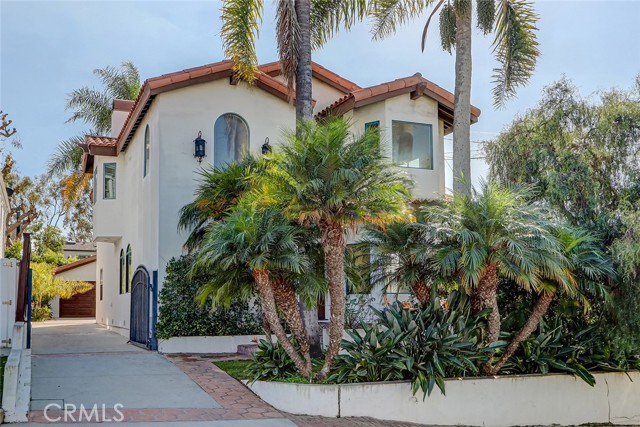
Manhattan Beach, CA 90266
Open house: Sat 2-4pm (11/14)
$3,699,000
4 BD · 3 BA · 2,604 SQFT
Listed by Dave Fratello, Edge
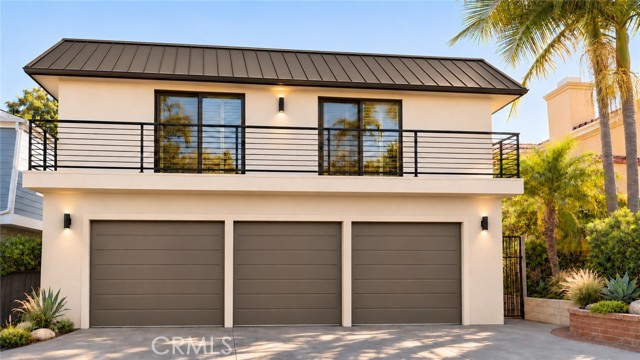
Manhattan Beach, CA 90266
Open house: Sat 2-4pm (11/14)
$3,500,000
4 BD · 3 BA · 3,190 SQFT
Listed by Emily Piemonte, Estate Properties
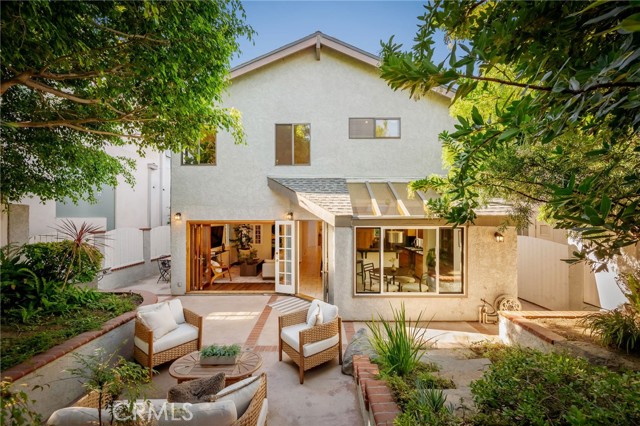
Manhattan Beach, CA 90266
Open house: Sat 2-4pm (11/14)
$3,499,000
5 BD · 4 BA · 3,442 SQFT
Listed by Robb Stroyke, Bayside
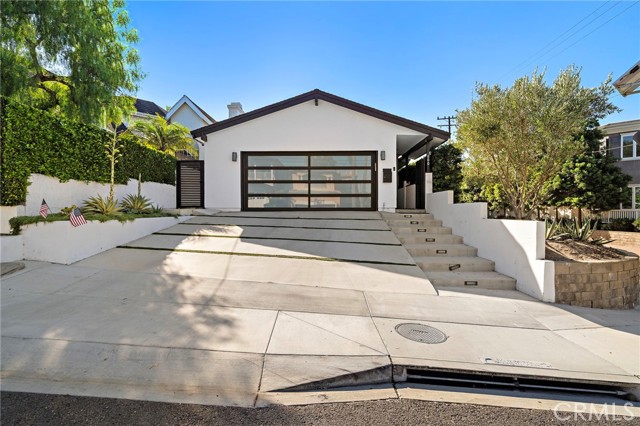
Manhattan Beach, CA 90266
$3,275,000
3 BD · 2 BA · 2,346 SQFT
Listed by Johnny Miller, West Shores Realty, Inc.
1–6 of 12
Listings provided by CRMLS. “Listed by” identifies the listing agent and brokerage; Kyle Shutts and Arbor Real Estate are the advertising broker unless otherwise noted. Information is deemed reliable but not guaranteed and should be independently verified. Inquiries are answered by Kyle Shutts, Arbor Real Estate.
At a Glance
Home figures from CRMLS sales and listings as of .
Market Conditions
Seller’s Market
1.9 months of supply
16 homes are for sale, and about 8.3 sell each month, so today’s inventory would sell out in about 1.9 months at the current pace. Under 4 months generally favors sellers; over 6 favors buyers.
12
New Listings, Last 30 Days
5
In Escrow Now
19%
Listings With a Price Cut
Median cut 2.0%
13
Median Days on Market, Listed Now
$2.69M to $8.63M
Asking Prices Now
Homes for sale and in escrow from CRMLS as of ; sales as of . Months of supply divides homes for sale by the average monthly sales of the last 12 months.
Market Trends
Homes sold in Tree Section over the last 12 months, from CRMLS closed sales as of . Updated weekly.
100
Homes Sold, 12 Months
▲ 8.7% vs prior year
$3,725,000
Median Sold Price
▲ 9.2% vs prior year
$1,539
Median Price per Sq Ft
▲ 8.0% vs prior year
21
Avg. Days on Market
▼ 5 days vs prior year
100.0%
Sale-to-List Price
▲ 0.0 pts vs prior year
39%
Sold Over Asking
$404.7M
Total Sales Volume
$10.5M
Highest Sale, 12 Months
Highest sale of the last 12 months: 676 18th Street, $10,500,000, closed Dec 2025. Listed by Brett Zebrowski, eXp Realty of California Inc.
| Month | Sales | Median sold price | Median price per sq ft | Sale-to-list |
|---|---|---|---|---|
| Nov 2025 | 6 | $3,004,500 | $1,495 | 100.2% |
| Dec 2025 | 7 | $3,005,000 | $1,494 | 98.9% |
| Jan 2026 | 1 | – | – | – |
| Feb 2026 | 6 | $3,664,000 | $1,794 | 104.8% |
| Mar 2026 | 12 | $3,275,000 | $1,628 | 98.1% |
| Apr 2026 | 13 | $4,150,000 | $1,604 | 101.4% |
| May 2026 | 11 | $3,238,000 | $1,417 | 100.0% |
| Jun 2026 | 10 | $4,625,000 | $1,471 | 100.0% |
| Jul 2026 | 11 | $3,230,000 | $1,438 | 100.0% |
| Aug 2026 | 4 | $2,162,500 | $1,374 | 100.0% |
| Sep 2026 | 10 | $4,977,500 | $1,605 | 100.0% |
| Oct 2026 | 9 | $3,485,000 | $1,640 | 100.0% |
A gap or dash means fewer than 3 sales in that month.
Inside the Numbers
The last 12 months of closed sales, broken down by price, bedrooms and home type.
“At asking” means within half a percent of the final list price.
| Bedrooms | Sales | Median price | Median size | Price / sq ft |
|---|---|---|---|---|
| Studio or 1 bedroom | 1 | – | – | – |
| 2 bedrooms | 8 | $2,100,000 | 1,127 sq ft | $2,007 |
| 3 bedrooms | 34 | $3,000,000 | 1,806 sq ft | $1,631 |
| 4 bedrooms | 21 | $3,502,000 | 2,326 sq ft | $1,387 |
| 5 bedrooms | 32 | $5,280,313 | 3,491 sq ft | $1,516 |
| 6+ bedrooms | 4 | $6,850,000 | 5,345 sq ft | $1,622 |
| Type | Sales | Median price | Price / sq ft | Median days | Sale-to-list |
|---|---|---|---|---|---|
| Single-family home | 99 | $3,750,000 | $1,539 | 8 | 100.0% |
| Multi-unit | 1 | – | – | – | – |
From CRMLS closed sales as of . A dash means fewer than 3 sales in that group.
By Price
Recent sales split into thirds by price, over the last 12 months.
$1.5 million to $3 million
Typically 3 bedrooms, about 1,571 sq ft, on lots around 4,616 sq ft, most often a single-family home. Based on 34 sales.
$3.02 million to $4.45 million
Typically 4 bedrooms, about 2,428 sq ft, on lots around 4,643 sq ft, most often a single-family home. Based on 34 sales.
$4.55 million to $10.5 million
Typically 5 bedrooms, about 3,540 sq ft, on lots around 4,803 sq ft, most often a single-family home. Based on 32 sales.
Recently Sold
| Address | Sold price | Listing credit | Beds / Baths | Sq ft | Sold |
|---|---|---|---|---|---|
| 2517 Elm Avenue | $4,775,000 | Listed by Justin Drury, Strand Hill Properties | 4 / 5 | 3,200 | Nov 10, 2026 |
| 657 27th Street | $6,250,000 | Listed by Todd Baker, Coldwell Banker Realty | 5 / 5 | 3,361 | Nov 9, 2026 |
| 583 36th Street | $3,890,000 | Listed by David Caskey, eXp Realty of California Inc | 4 / 4 | 3,829 | Oct 30, 2026 |
| 3504 N Poinsettia Avenue | $3,050,000 | Listed by Robb Stroyke, Bayside | 4 / 3 | 2,326 | Oct 14, 2026 |
| 747 23rd Street | $3,300,000 | Listed by Susan Boettner, Vista Sotheby’s International Realty | 2 / 2 | 1,302 | Oct 14, 2026 |
| 525 17th | $4,700,000 | Listed by Mark Norton, Ossia Real Estate | 3 / 1 | 1,226 | Oct 9, 2026 |
| 1808 Pacific Avenue | $2,700,000 | Listed by Sue Murphy, Keller Williams Realty | 3 / 2 | 1,646 | Oct 7, 2026 |
| 664 Rosecrans Avenue | $3,225,000 | Listed by Lauren Forbes, Compass | 3 / 4 | 3,002 | Oct 5, 2026 |
Sold listings provided by CRMLS. “Listed by” identifies the listing agent and listing brokerage. Kyle Shutts and Arbor Real Estate are the advertising broker unless otherwise noted. Information is deemed reliable but not guaranteed.
The Tree Section is the inland part of Manhattan Beach whose streets are named for trees, such as Elm, Oak and Pine. Lots are larger than near the beach, the streets are quiet and green, and families come for the space and the Manhattan Beach schools.
Homes range from original postwar houses to large new builds, many with real yards and pools that are hard to find closer to the ocean. Rebuilds are common, and the newest homes set the top of the market.
The Tree Section trades ocean views for space and calm. Parks, schools and the shops on Sepulveda are close, and the beach and downtown are a short bike ride or drive away.
Quiet residential blocks with larger lots and yards.
Blocks close to the city parks and schools.
Where It Is
For sale Sold in the last 12 months
Streets with a home sold or listed here in the last two years.
Questions
Over the last 12 months, the median sold price for homes in Tree Section was $3,725,000, across 100 sales, or about $1,539 per square foot. Single-family homes listed for sale now have a median asking price of $4,099,000. Figures are from CRMLS as of 2026-11-13.
Homes that sold in Tree Section over the last 12 months spent an average of 21 days on the market. The median home sold for 100.0% of its final list price.
Tree Section is a seller's market, with about 1.9 months of supply: 16 homes for sale against roughly 8 sales a month over the last year. Under 4 months of supply generally favors sellers and over 6 favors buyers. About 19% of current listings have had a price reduction. Figures are from CRMLS as of 2026-11-14.
Over the last 12 months, 39% of homes in Tree Section sold above their final asking price, 22% sold at asking and 39% sold below. The median home sold for 100.0% of its list price.
There are 16 homes for sale in Tree Section as of 2026-11-14, including 12 listed in the last 30 days, and 5 more are in escrow. Asking prices range from $2,695,000 to $8,629,000.
Most homes in Tree Section do not report HOA dues in recent sales and listings.
Streets with recent sales or listings in Tree Section include Agnes, Agnes Rd, Agnes Road, Bell Ave, Church Street, Elm Ave., Elm Avenue, Fisher Ave, Highview, and John, among others.
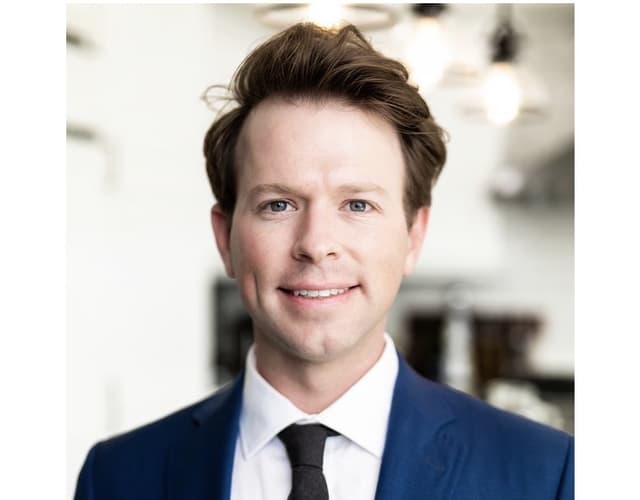
Meet Kyle

Real Estate Professional
Whether you’re buying your first home, upgrading, or selling a high-value property, my goal is simple: to protect your interests, maximize your outcome, and make the experience as smooth and stress-free as possible.
5.0
Google Rating
10+
Years Experience
1,000+
Transactions
$1B+
In Volume
Start Here
A confidential conversation about your timeline, your target areas, and current inventory, with no obligation.