
Santa Monica, CA 90402
859 Woodacres Road
$69,000,000
6 BD · 6 BA · 12,240 SQFT
Listed by Branden Williams, The Beverly Hills Estates
Santa Monica
51
Homes for Sale
$6,925,000
Single-Family Median List Price
$1,250,000
Condo & Townhome Median List Price
$1,748
Price per Sq Ft
67
Avg. Days on Market
$4,782,741
Avg. Sold Price (90 Days)
Active listings in North of Montana as of , per CRMLS. Sold price averages the 39 homes that closed in the last 90 days. Updated daily.
Current Listings
The 12 highest-priced homes on the market now, updated from CRMLS throughout the day.
Santa Monica, CA 90402
$69,000,000
6 BD · 6 BA · 12,240 SQFT
Listed by Branden Williams, The Beverly Hills Estates

Santa Monica, CA 90402
$35,000,000
7 BD · 11 BA · 10,300 SQFT
Listed by David Kramer, Compass

Santa Monica, CA 90402
$29,999,999
8 BD · 12 BA · 10,000 SQFT
Listed by Stacy White, Compass
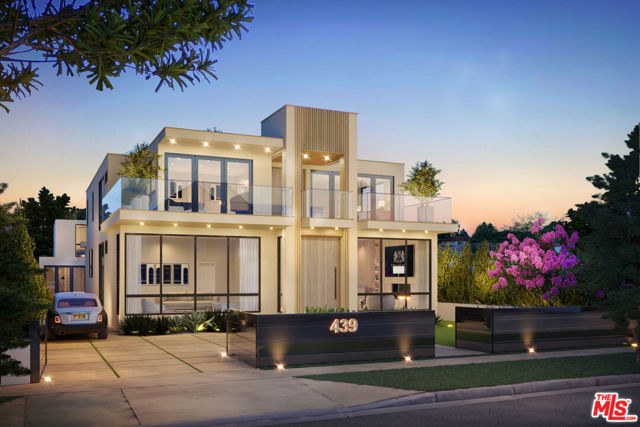
Santa Monica, CA 90402
$19,995,000
7 BD · 8 BA · 8,400 SQFT
Listed by Nicole Plaxen, Sotheby's International Realty

Santa Monica, CA 90402
$14,999,000
7 BD · 8 BA · 6,000 SQFT
Listed by Sally Forster Jones, Compass

Santa Monica, CA 90402
Open house: Sun 1-4pm (11/15)
$13,998,000
6 BD · 8 BA · 8,008 SQFT
Listed by David Berg, Compass
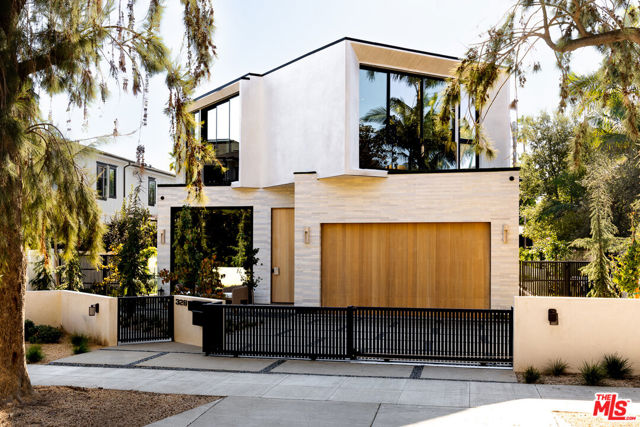
Santa Monica, CA 90402
Open house: Sun 1-4pm (11/15)
$13,995,000
7 BD · 9 BA · 7,497 SQFT
Listed by Shirli Depas, Compass
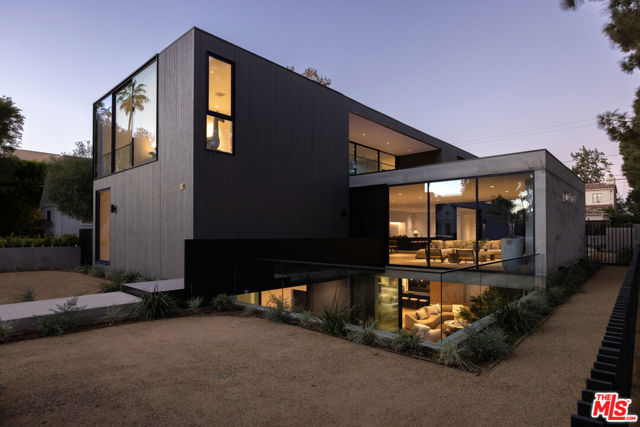
Santa Monica, CA 90402
Open house: Sun 1-4pm (11/15)
$13,595,000
6 BD · 8 BA · 6,654 SQFT
Listed by Felix Wong, Sunshine Realty
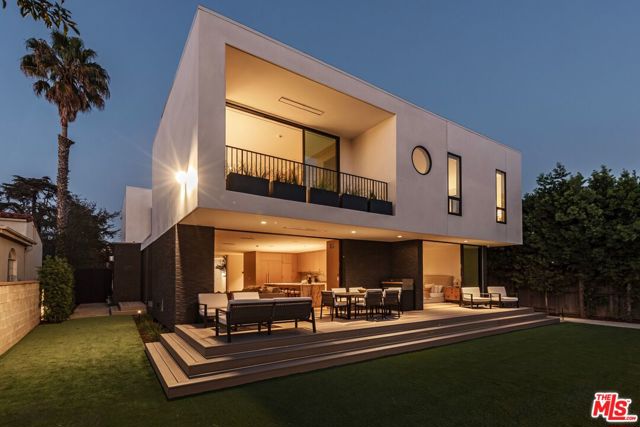
Santa Monica, CA 90402
Open house: Sun 1-4pm (11/15)
$12,785,000
7 BD · 6 BA · 5,547 SQFT
Listed by John Hathorn, Compass

Santa Monica, CA 90402
$12,495,000
5 BD · 5 BA · 4,260 SQFT
Listed by Shahryar Bastani, Christie's International Real Estate SoCal

Santa Monica, CA 90402
Open house: Sun 1-4pm (11/15)
$11,495,000
6 BD · 6 BA · 5,898 SQFT
Listed by Cynthia Ambuehl, Christie's International Real Estate SoCal
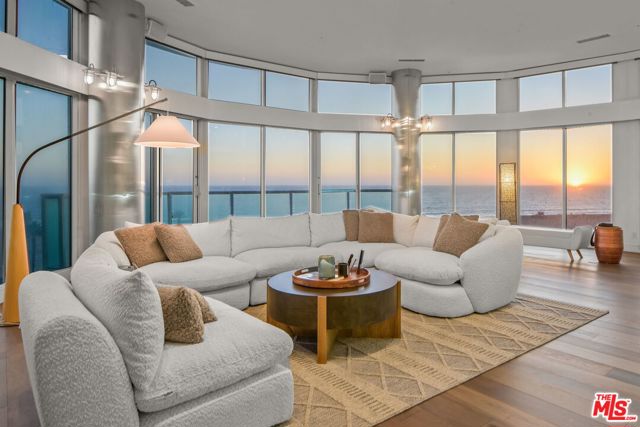
Santa Monica, CA 90402
$10,999,000
3 BD · 4 BA · 4,148 SQFT
Listed by Julie Scully, Julie Scully
1–6 of 12
Listings provided by CRMLS. “Listed by” identifies the listing agent and brokerage; Kyle Shutts and Arbor Real Estate are the advertising broker unless otherwise noted. Information is deemed reliable but not guaranteed and should be independently verified. Inquiries are answered by Kyle Shutts, Arbor Real Estate.
At a Glance
Home figures from CRMLS sales and listings as of .
Market Conditions
Balanced Market
4.1 months of supply
51 homes are for sale, and about 13 sell each month, so today’s inventory would sell out in about 4.1 months at the current pace. Under 4 months generally favors sellers; over 6 favors buyers.
11
New Listings, Last 30 Days
11
In Escrow Now
37%
Listings With a Price Cut
Median cut 6.3%
39
Median Days on Market, Listed Now
$592K to $69M
Asking Prices Now
Homes for sale and in escrow from CRMLS as of ; sales as of . Months of supply divides homes for sale by the average monthly sales of the last 12 months.
Market Trends
Homes sold in North of Montana over the last 12 months, from CRMLS closed sales as of . Updated weekly.
151
Homes Sold, 12 Months
▼ 7.9% vs prior year
$4,350,000
Median Sold Price
▼ 11.7% vs prior year
$1,672
Median Price per Sq Ft
▲ 1.6% vs prior year
53
Avg. Days on Market
▲ 1 days vs prior year
97.4%
Sale-to-List Price
▼ 1.1 pts vs prior year
21%
Sold Over Asking
$763.3M
Total Sales Volume
$22.9M
Highest Sale, 12 Months
Highest sale of the last 12 months: 2555 La Mesa Drive, $22,950,000, closed Dec 2025. Listed by Amir Jawaherian, The Agency.
| Month | Sales | Median sold price | Median price per sq ft | Sale-to-list |
|---|---|---|---|---|
| Nov 2025 | 9 | $3,900,000 | $1,497 | 103.7% |
| Dec 2025 | 13 | $6,700,000 | $2,052 | 95.1% |
| Jan 2026 | 7 | $3,900,000 | $1,417 | 97.6% |
| Feb 2026 | 9 | $4,470,000 | $1,672 | 95.3% |
| Mar 2026 | 12 | $2,700,000 | $1,662 | 95.8% |
| Apr 2026 | 14 | $3,987,500 | $1,877 | 100.0% |
| May 2026 | 19 | $4,650,000 | $1,651 | 99.1% |
| Jun 2026 | 14 | $5,025,000 | $1,417 | 97.9% |
| Jul 2026 | 12 | $6,956,098 | $1,658 | 95.4% |
| Aug 2026 | 16 | $4,076,000 | $1,407 | 99.1% |
| Sep 2026 | 15 | $3,573,000 | $1,764 | 97.0% |
| Oct 2026 | 10 | $7,912,500 | $1,727 | 97.0% |
A gap or dash means fewer than 3 sales in that month.
Inside the Numbers
The last 12 months of closed sales, broken down by price, bedrooms and home type.
“At asking” means within half a percent of the final list price.
| Bedrooms | Sales | Median price | Median size | Price / sq ft |
|---|---|---|---|---|
| Studio or 1 bedroom | 11 | $1,099,000 | 906 sq ft | $1,214 |
| 2 bedrooms | 30 | $2,125,000 | 1,490 sq ft | $1,447 |
| 3 bedrooms | 51 | $3,800,000 | 1,920 sq ft | $1,874 |
| 4 bedrooms | 22 | $5,500,000 | 3,148 sq ft | $1,947 |
| 5 bedrooms | 24 | $8,337,500 | 5,036 sq ft | $1,716 |
| 6+ bedrooms | 13 | $9,710,000 | 6,370 sq ft | $1,342 |
| Type | Sales | Median price | Price / sq ft | Median days | Sale-to-list |
|---|---|---|---|---|---|
| Single-family home | 102 | $5,297,500 | $1,837 | 23 | 97.4% |
| Condominium | 41 | $2,000,000 | $1,280 | 32 | 97.0% |
| Co-op | 5 | $1,915,000 | $1,232 | 141 | 95.9% |
| Townhome | 2 | – | – | – | – |
| Other | 1 | – | – | – | – |
From CRMLS closed sales as of . A dash means fewer than 3 sales in that group.
By Price
Recent sales split into thirds by price, over the last 12 months.
$625K to $3 million
Typically 2 bedrooms, about 1,490 sq ft, on lots around 24,197 sq ft, most often a condominium. Based on 51 sales.
$3.1 million to $5.61 million
Typically 3 bedrooms, about 2,142 sq ft, on lots around 7,527 sq ft, most often a single-family home. Based on 51 sales.
$5.65 million to $22.9 million
Typically 5 bedrooms, about 4,797 sq ft, on lots around 8,951 sq ft, most often a single-family home. Based on 49 sales.
Recently Sold
| Address | Sold price | Listing credit | Beds / Baths | Sq ft | Sold |
|---|---|---|---|---|---|
| 515 Ocean Avenue #307S | $2,310,000 | Listed by Christina Graziano, Keller Williams Beverly Hills | 3 / 3 | 1,900 | Nov 13, 2026 |
| 533 Lincoln Boulevard | $3,750,000 | Listed by Jacqueline Cahen, Compass | 3 / 3 | 1,947 | Nov 12, 2026 |
| 756 Kingman Avenue | $3,150,000 | Listed by Marny Maslon, Douglas Elliman of California, Inc. | 3 / 3 | 2,039 | Nov 6, 2026 |
| 630 Hightree Road | $4,900,000 | Listed by Cynthia Ambuehl, Christie's International Real Estate SoCal | 3 / 3 | 2,724 | Nov 5, 2026 |
| 201 Ocean Avenue #1207 B | $625,000 | Listed by Denise Snanoudj, The Agency | 0 / 1 | 515 | Nov 3, 2026 |
| 622 24th Street | $9,710,000 | Listed by Cynthia Ambuehl, Christie's International Real Estate SoCal | 6 / 7 | 8,350 | Nov 2, 2026 |
| 507 12th Street | $7,875,000 | Listed by Robin Walpert, Sotheby's International Realty | 5 / 6 | 4,575 | Oct 30, 2026 |
| 540 Lincoln Boulevard | $7,600,000 | Listed by Jamele Mason, Thomas James Real Estate Services, Inc | 6 / 7 | 4,142 | Oct 30, 2026 |
Sold listings provided by CRMLS. “Listed by” identifies the listing agent and listing brokerage. Kyle Shutts and Arbor Real Estate are the advertising broker unless otherwise noted. Information is deemed reliable but not guaranteed.
North of Montana is the residential heart of Santa Monica, the blocks north of Montana Avenue up to the city line. Its wide, tree-lined streets and large lots make it one of the most sought-after family neighborhoods on the Westside, a few minutes from the beach.
Homes range from Spanish and traditional houses of the 1920s to large new builds, and rebuilds have steadily raised the top of the market. Lot size, the street and the house itself drive value.
Montana Avenue's shops and cafes are a walk away, the beach and the bluffs are close, and the Santa Monica-Malibu schools are a draw for families.
Close to the shops and cafes.
Quieter blocks toward San Vicente and the city line.
Where It Is
For sale Sold in the last 12 months
Streets with a home sold or listed here in the last two years.
Questions
Over the last 12 months, the median sold price for homes in North of Montana was $4,350,000, across 151 sales, or about $1,672 per square foot. Single-family homes listed for sale now have a median asking price of $6,925,000. Figures are from CRMLS as of 2026-11-13.
Homes that sold in North of Montana over the last 12 months spent an average of 53 days on the market. The median home sold for 97.4% of its final list price.
North of Montana is a balanced market, with about 4.1 months of supply: 51 homes for sale against roughly 13 sales a month over the last year. Under 4 months of supply generally favors sellers and over 6 favors buyers. About 37% of current listings have had a price reduction. Figures are from CRMLS as of 2026-11-14.
Over the last 12 months, 21% of homes in North of Montana sold above their final asking price, 16% sold at asking and 63% sold below. The median home sold for 97.4% of its list price.
There are 51 homes for sale in North of Montana as of 2026-11-14, including 11 listed in the last 30 days, and 11 more are in escrow. Asking prices range from $592,000 to $69,000,000.
About 31% of homes sold or listed in North of Montana recently report HOA dues, with a median of $1,453 per month. Confirm the current amount and what it covers before you buy.
Streets with recent sales or listings in North of Montana include Adelaide Place, Alta Avenue, Amalfi Drive, Dryad Road, E Channel Road, E Rustic Road, Entrada Drive, Euclid Street, Georgina Avenue, and Hightree Road, among others.

Meet Kyle

Real Estate Professional
Whether you’re buying your first home, upgrading, or selling a high-value property, my goal is simple: to protect your interests, maximize your outcome, and make the experience as smooth and stress-free as possible.
5.0
Google Rating
10+
Years Experience
1,000+
Transactions
$1B+
In Volume
Start Here
A confidential conversation about your timeline, your target areas, and current inventory, with no obligation.