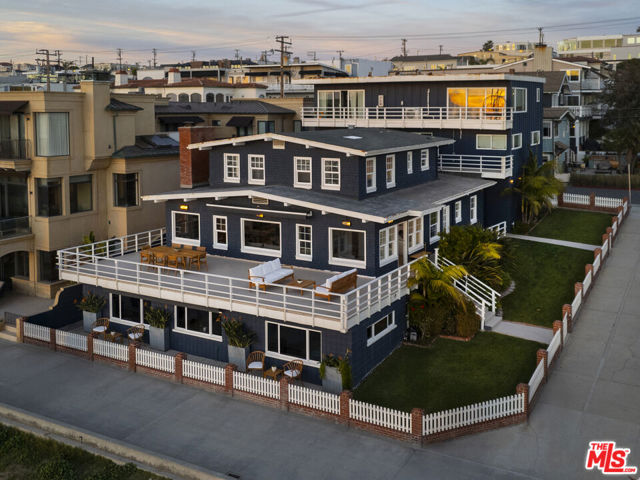
Manhattan Beach, CA 90266
1000 The Strand
$25,000,000
10 BD · 9 BA · 5,967 SQFT
Listed by Nicole Plaxen, Sotheby's International Realty
Manhattan Beach
31
Homes for Sale
$5,750,000
Single-Family Median List Price
$4,199,000
Condo & Townhome Median List Price
$2,380
Price per Sq Ft
39
Avg. Days on Market
$4,887,053
Avg. Sold Price (90 Days)
Active listings in Sand Section as of , per CRMLS. Sold price averages the 38 homes that closed in the last 90 days. Updated daily.
Current Listings
The 12 highest-priced homes on the market now, updated from CRMLS throughout the day.
Manhattan Beach, CA 90266
$25,000,000
10 BD · 9 BA · 5,967 SQFT
Listed by Nicole Plaxen, Sotheby's International Realty
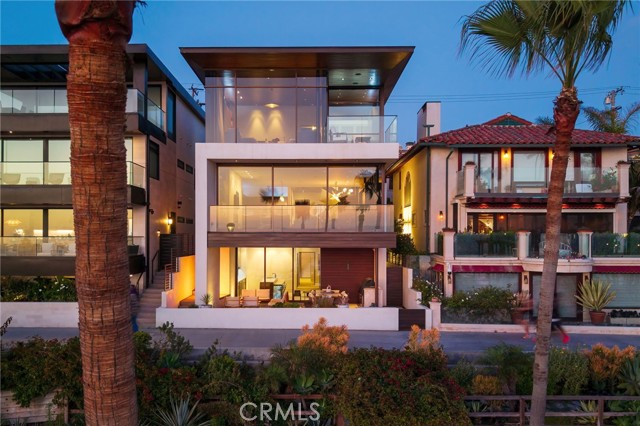
Manhattan Beach, CA 90266
$23,950,000
4 BD · 5 BA · 5,372 SQFT
Listed by Michael Pennings, Estate Properties
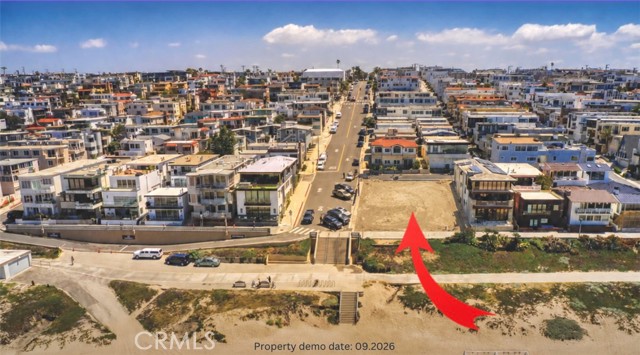
Manhattan Beach, CA 90266
$13,999,999
17 BD · 15 BA · 8,880 SQFT
Listed by Giovanni Altamura, S C Real Estate
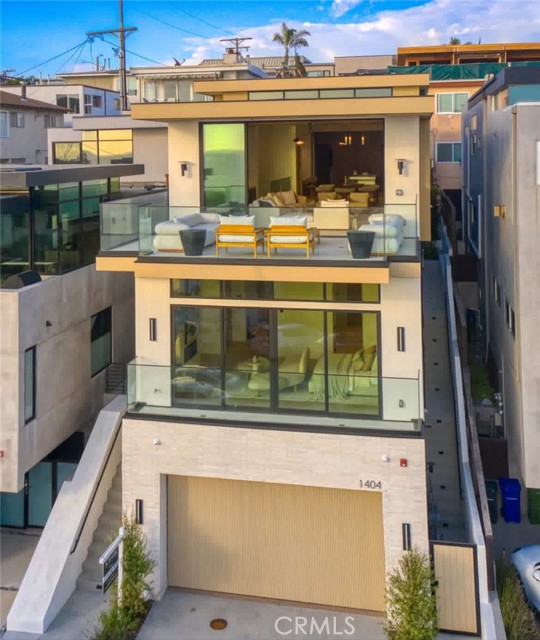
Manhattan Beach, CA 90266
$13,995,000
5 BD · 6 BA · 4,274 SQFT
Listed by Giovanni Altamura, S C Real Estate
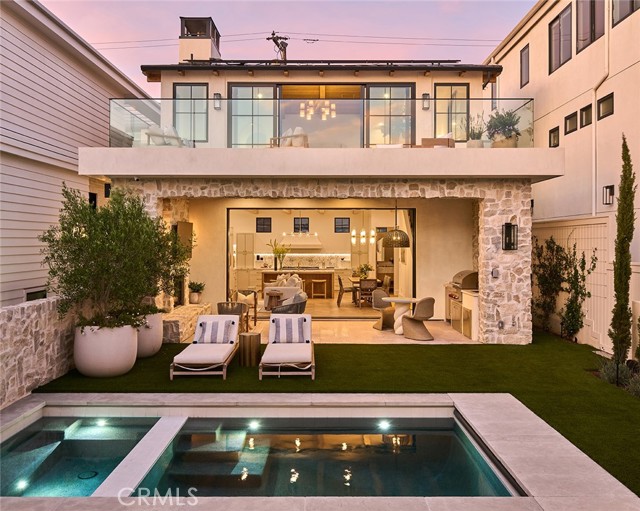
Manhattan Beach, CA 90266
$13,250,000
4 BD · 4 BA · 3,013 SQFT
Listed by Jennifer Caskey, Compass

Manhattan Beach, CA 90266
$11,995,000
5 BD · 7 BA · 4,319 SQFT
Listed by Bryn Stroyke, Bayside

Manhattan Beach, CA 90266
$10,495,000
4 BD · 3 BA · 2,365 SQFT
Listed by Bryn Stroyke, Bayside
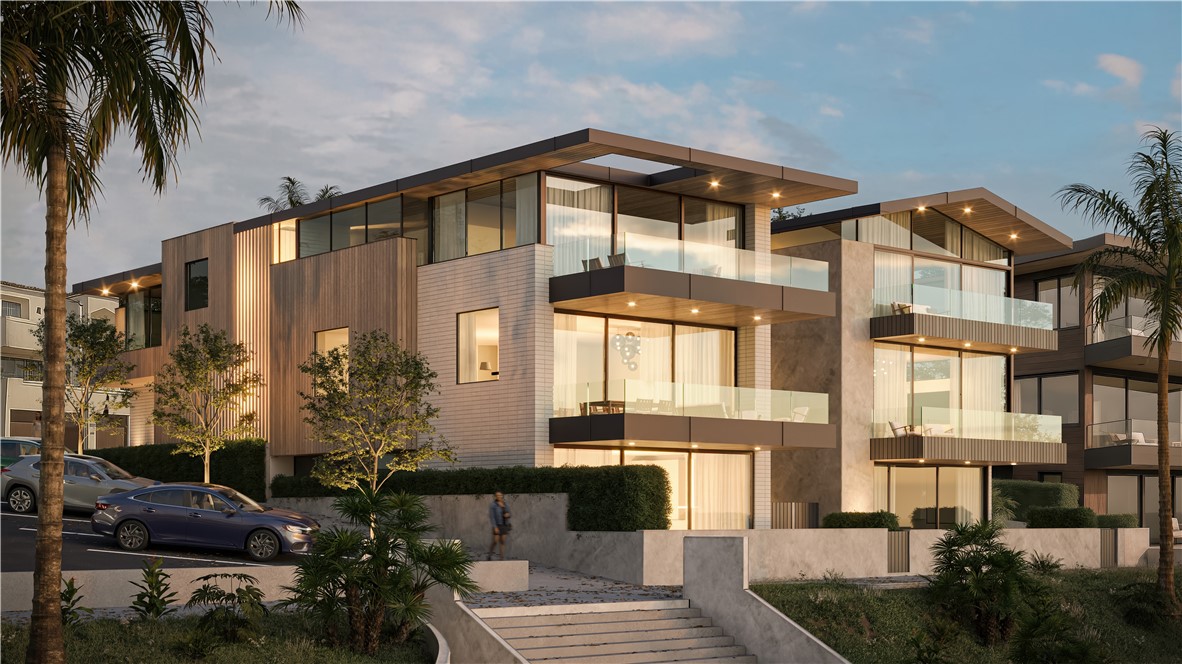
Manhattan Beach, CA 90266
$9,999,999
17 BD · 15 BA · 8,880 SQFT
Listed by Giovanni Altamura, S C Real Estate
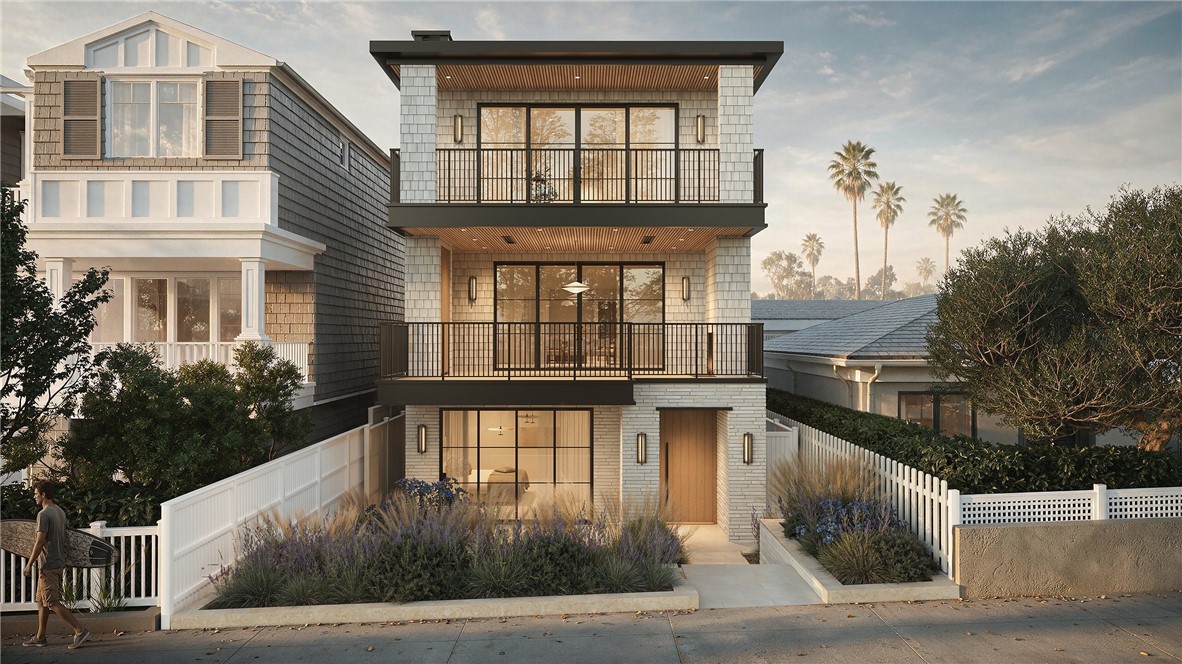
Manhattan Beach, CA 90266
$9,500,000
5 BD · 5 BA · 4,186 SQFT
Listed by Giovanni Altamura, S C Real Estate

Manhattan Beach, CA 90266
$8,990,000
4 BD · 4 BA · 2,436 SQFT
Listed by Shawn Dugan, Strand Hill Properties

Manhattan Beach, CA 90266
Open house: Sat 1-4pm (11/14)
$8,150,000
4 BD · 5 BA · 4,554 SQFT
Listed by Tim Lesser, Keller Williams Luxury
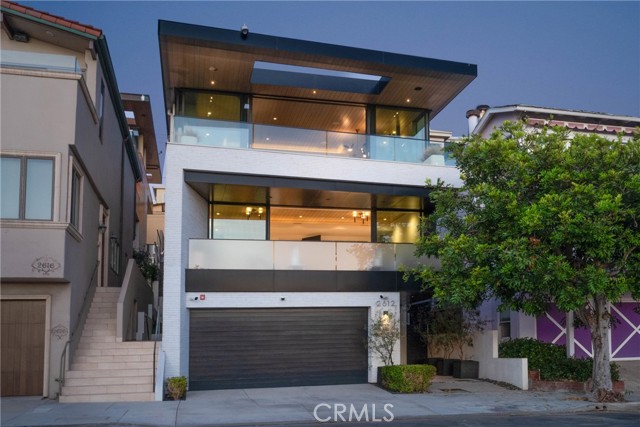
Manhattan Beach, CA 90266
$6,999,000
4 BD · 5 BA · 2,745 SQFT
Listed by Jennifer Caskey, Compass
1–6 of 12
Listings provided by CRMLS. “Listed by” identifies the listing agent and brokerage; Kyle Shutts and Arbor Real Estate are the advertising broker unless otherwise noted. Information is deemed reliable but not guaranteed and should be independently verified. Inquiries are answered by Kyle Shutts, Arbor Real Estate.
At a Glance
Home figures from CRMLS sales and listings as of .
Market Conditions
Seller’s Market
2.9 months of supply
31 homes are for sale, and about 11 sell each month, so today’s inventory would sell out in about 2.9 months at the current pace. Under 4 months generally favors sellers; over 6 favors buyers.
13
New Listings, Last 30 Days
7
In Escrow Now
32%
Listings With a Price Cut
Median cut 6.0%
17
Median Days on Market, Listed Now
$1.95M to $25M
Asking Prices Now
Homes for sale and in escrow from CRMLS as of ; sales as of . Months of supply divides homes for sale by the average monthly sales of the last 12 months.
Market Trends
Homes sold in Sand Section over the last 12 months, from CRMLS closed sales as of . Updated weekly.
128
Homes Sold, 12 Months
▲ 42.2% vs prior year
$4,377,500
Median Sold Price
▲ 17.5% vs prior year
$1,953
Median Price per Sq Ft
▲ 11.0% vs prior year
46
Avg. Days on Market
▲ 7 days vs prior year
99.2%
Sale-to-List Price
▲ 0.6 pts vs prior year
21%
Sold Over Asking
$622.1M
Total Sales Volume
$16M
Highest Sale, 12 Months
Highest sale of the last 12 months: 2420 The Strand, $16,000,000, closed Jul 2026. Listed by Alejandro Abad, Tower-60.
| Month | Sales | Median sold price | Median price per sq ft | Sale-to-list |
|---|---|---|---|---|
| Nov 2025 | 11 | $3,600,000 | $1,986 | 94.6% |
| Dec 2025 | 7 | $3,350,000 | $1,073 | 94.5% |
| Jan 2026 | 4 | $4,060,000 | $1,823 | 100.0% |
| Feb 2026 | 6 | $4,166,500 | $1,355 | 99.3% |
| Mar 2026 | 11 | $4,200,000 | $1,737 | 100.0% |
| Apr 2026 | 11 | $4,800,000 | $2,051 | 99.6% |
| May 2026 | 9 | $5,000,000 | $2,233 | 100.0% |
| Jun 2026 | 11 | $4,800,000 | $2,085 | 100.0% |
| Jul 2026 | 19 | $4,500,000 | $1,952 | 99.4% |
| Aug 2026 | 7 | $3,875,000 | $1,924 | 97.0% |
| Sep 2026 | 13 | $3,950,000 | $1,934 | 99.3% |
| Oct 2026 | 18 | $5,207,500 | $1,998 | 98.6% |
A gap or dash means fewer than 3 sales in that month.
Inside the Numbers
The last 12 months of closed sales, broken down by price, bedrooms and home type.
“At asking” means within half a percent of the final list price.
| Bedrooms | Sales | Median price | Median size | Price / sq ft |
|---|---|---|---|---|
| Studio or 1 bedroom | 1 | – | – | – |
| 2 bedrooms | 19 | $2,800,000 | 1,355 sq ft | $2,251 |
| 3 bedrooms | 48 | $3,200,000 | 1,916 sq ft | $1,879 |
| 4 bedrooms | 32 | $5,800,000 | 2,829 sq ft | $2,004 |
| 5 bedrooms | 23 | $6,990,000 | 3,700 sq ft | $1,929 |
| 6+ bedrooms | 5 | $5,650,000 | 4,844 sq ft | $1,201 |
| Type | Sales | Median price | Price / sq ft | Median days | Sale-to-list |
|---|---|---|---|---|---|
| Single-family home | 75 | $4,500,000 | $1,961 | 19 | 99.3% |
| Townhome | 30 | $3,887,500 | $1,939 | 20 | 98.4% |
| Multi-unit | 18 | $5,320,000 | $1,977 | 14 | 99.8% |
| Condominium | 4 | $3,699,500 | $1,896 | 11 | 96.5% |
| Commercial/Residential | 1 | – | – | – | – |
From CRMLS closed sales as of . A dash means fewer than 3 sales in that group.
By Price
Recent sales split into thirds by price, over the last 12 months.
$1.59 million to $3.27 million
Typically 3 bedrooms, about 1,676 sq ft, on lots around 1,807 sq ft, most often a single-family home. Based on 43 sales.
$3.33 million to $5.62 million
Typically 3 bedrooms, about 2,170 sq ft, on lots around 2,701 sq ft, most often a single-family home. Based on 43 sales.
$5.65 million to $16 million
Typically 4 bedrooms, about 3,588 sq ft, on lots around 2,708 sq ft, most often a single-family home. Based on 42 sales.
Recently Sold
| Address | Sold price | Listing credit | Beds / Baths | Sq ft | Sold |
|---|---|---|---|---|---|
| 2104 Highland | $2,250,000 | Listed by Aaron Klapper, eXp Realty of California, Inc. | 2 / 3 | 1,644 | Nov 12, 2026 |
| 121 16th Street | $9,665,000 | Listed by Lee LeGrande, eXp Realty of California Inc | 4 / 5 | 4,188 | Nov 9, 2026 |
| 2417 Crest | $5,050,000 | Listed by Robert Freedman, DOMO Real Estate | 3 / 4 | 2,292 | Nov 5, 2026 |
| 4308 Crest Drive | $3,325,000 | Listed by Brett Zebrowski, eXp Realty of California Inc | 5 / 3 | 1,638 | Nov 3, 2026 |
| 465 32nd St | $4,795,000 | Listed by Robert Sillman, Robert Sillman | 4 / 4 | 4,111 | Oct 30, 2026 |
| 201 5th | $5,620,000 | Listed by Kurt Allen, Compass | 3 / 4 | 2,170 | Oct 29, 2026 |
| 436 27th Street | $5,800,000 | Listed by Edward Kaminsky, eXp Realty of California, Inc | 4 / 5 | 3,607 | Oct 28, 2026 |
| 3208 Manhattan Avenue | $3,700,000 | Listed by Bill Ruane, Estate Properties | 3 / 2 | 1,788 | Oct 23, 2026 |
Sold listings provided by CRMLS. “Listed by” identifies the listing agent and listing brokerage. Kyle Shutts and Arbor Real Estate are the advertising broker unless otherwise noted. Information is deemed reliable but not guaranteed.
The Sand Section is the part of Manhattan Beach closest to the ocean, the blocks between the beach and the hill rising inland. Its walk streets, lanes closed to cars and lined with front gardens, run down toward the water, and almost every home is a short walk to the sand, the pier and downtown.
Lots are small and close together, so homes are built up: two and three stories, roof decks, and glass toward the ocean. Most of the original beach cottages have been replaced with modern homes. Position decides value: a walk street, an ocean view, and how close the home is to the beach.
This is the most walkable corner of the South Bay. Residents walk to the beach, the pier, the shops and restaurants downtown, and the farmers market, and many leave the car in the garage all weekend.
Car-free lanes running toward the ocean, the heart of the Sand Section.
The north end, closest to the surf break and a little more casual.
The blocks around Manhattan Beach Boulevard and the pier.
Where It Is
For sale Sold in the last 12 months
Streets with a home sold or listed here in the last two years.
Questions
Over the last 12 months, the median sold price for homes in Sand Section was $4,377,500, across 128 sales, or about $1,953 per square foot. Single-family homes listed for sale now have a median asking price of $5,750,000. Figures are from CRMLS as of 2026-11-13.
Homes that sold in Sand Section over the last 12 months spent an average of 46 days on the market. The median home sold for 99.2% of its final list price.
Sand Section is a seller's market, with about 2.9 months of supply: 31 homes for sale against roughly 11 sales a month over the last year. Under 4 months of supply generally favors sellers and over 6 favors buyers. About 32% of current listings have had a price reduction. Figures are from CRMLS as of 2026-11-14.
Over the last 12 months, 21% of homes in Sand Section sold above their final asking price, 27% sold at asking and 52% sold below. The median home sold for 99.2% of its list price.
There are 31 homes for sale in Sand Section as of 2026-11-14, including 13 listed in the last 30 days, and 7 more are in escrow. Asking prices range from $1,950,000 to $25,000,000.
Most homes in Sand Section do not report HOA dues in recent sales and listings.
Streets with recent sales or listings in Sand Section include Alma, Alma Ave, Alma Avenue, Bayview, Bayview Drive, Crest, Crest Drive, El Porto Street, Grandview Avenue, and Gull Street, among others.
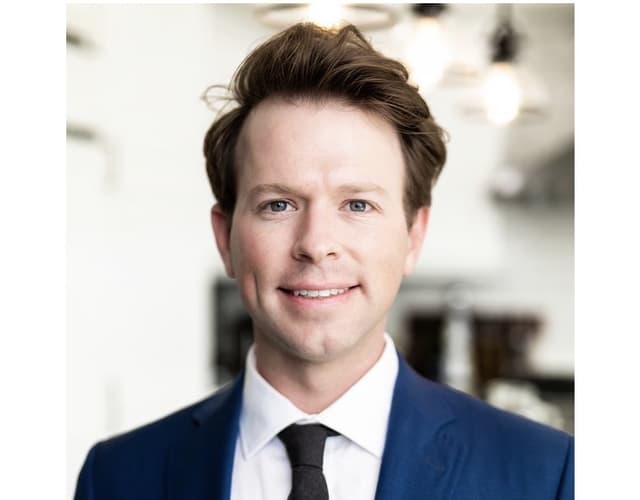
Meet Kyle

Real Estate Professional
Whether you’re buying your first home, upgrading, or selling a high-value property, my goal is simple: to protect your interests, maximize your outcome, and make the experience as smooth and stress-free as possible.
5.0
Google Rating
10+
Years Experience
1,000+
Transactions
$1B+
In Volume
Start Here
A confidential conversation about your timeline, your target areas, and current inventory, with no obligation.